Most organizations have North America operations whether corporate headquarters is based in Canada or the U.S. Understanding the fundamental operating framework of HR management helps to navigate across borders, especially when it comes to total rewards programs. As a baseline of comparison, Canada is organized into 13 provinces, whereas the U.S. has 50 states. From an HR perspective, compliance is governed at the provincial and state levels with some overarching federal labor regulations.
Another important consideration is the country’s culture or philosophy toward labor relations and the implications on the HR or total rewards programs. In the U.S., roughly 5% of the overall population are in unions (14.5 million union members in a 319 million population), whereas Canada sees almost 15% of the population in a union (e.g., 4.7 million union member in a 35 million overall population). How does this potentially translate to HR programs?
Let’s take a look at health care, which is a significant financial component of total rewards. In the U.S., health care coverage is still “privately” managed with an entrepreneurial business model, whereas, in Canada, primary health plan coverage is a single payor, federally funded program with a paternalistic business model that is administered and managed at the provincial level. Canadian companies may choose to pick- up the employee portion of the costs to fund the national health care plan as a competitive practice. They may also offer supplemental health care plans that fill the gaps not provided by the national plans, such as comprehensive dental coverage. Notwithstanding countries that have government health care systems, the private sector competitive practices may also follow this Canadian example (e.g., supplemental health care plans) with a similar approach.
The other area that North America HR leaders need to evaluate concerns the similarities and differences in the labor markets. Let’s begin by analyzing the compensation differentials in each of the provinces with an example for Human Resources Analyst in the Oil and Gas Exploration and Extraction industry sector.
Source: ERI’s Salary Assessor
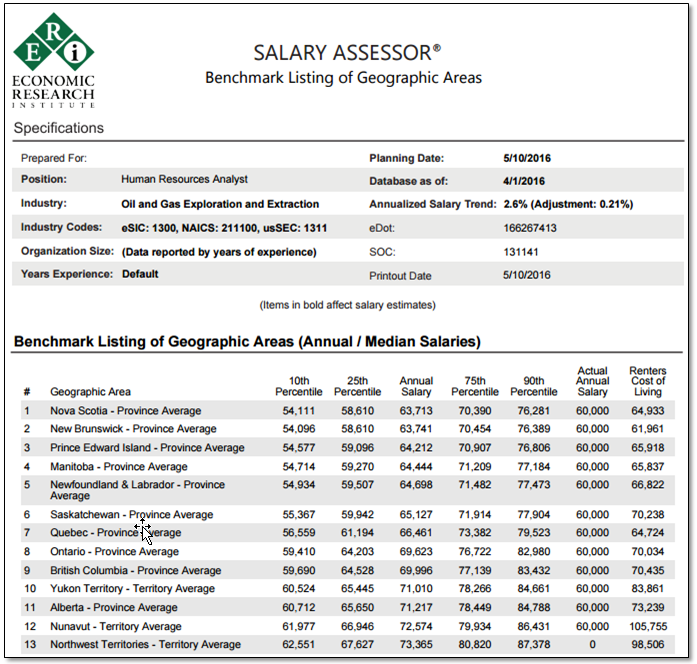
This report displays the 10th, 25th, Annual Median Salary, 75th, and 90th percentile benchmarks. The data is sorted in ascending order based on the median annual salary values. By doing so, you determine that the median salary range for this job across the 13 provinces is 63,713 CAD to 73,365 CAD, with Nova Scotia being the lowest and Northwest Territories the highest.
Another meaningful analysis to evaluate the compensation for Human Resource Analyst in the Oil and Gas Exploration and Extraction industry sector is reviewing the geographic differentials for the capital cities in each of the provinces.
Source: ERI’s Salary Assessor
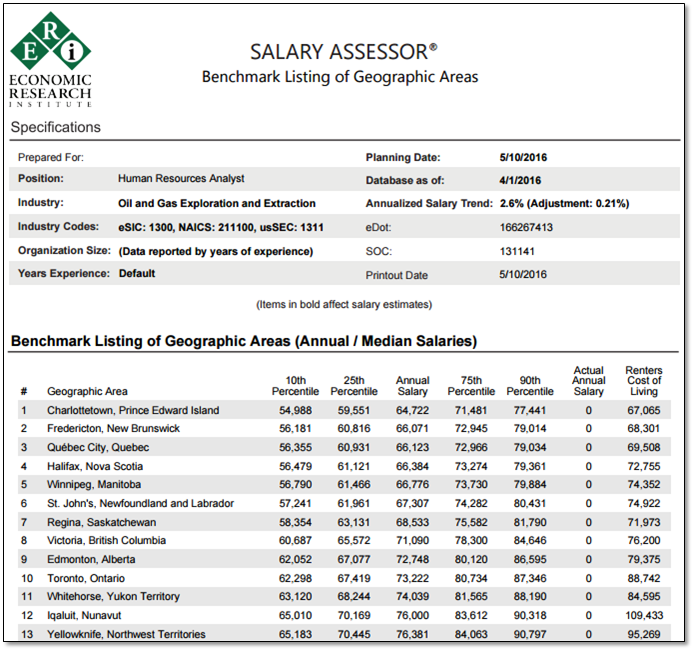
This report displays the geographic labor markets for the 13 provincial capitals in ascending order based on the median annual salary for Human Resource Analyst. The base salary range is 64,722 CAD to 76,381 CAD, with Charlottetown, Prince Edward Island, being the lowest and Yellowknife, Northwest Territories, the highest. Comparing the Northwest Territories province median salary of CAD 73,365 with the CAD 76,381 benchmark for Yellowknife, there is approximately a 7% differential, which can be instrumental in attracting, engaging, motivating, and retaining top talent. As an HR leader, it is essential to keep a pulse on these differences to ensure that pay is not a driver of exits and turnover in your organization.
Next, let’s look at North America labor markets for executives, which are more broadly defined from a geography perspective, with industry and revenue size of the organization being key determinants of compensation. Most executive compensation benchmarks begin with data that is disclosed by publicly-traded companies via the required annual filings. In Canada, these are the Information Circulars filed through the Sedar system and, in the U.S., these are the annual Proxy Statements (or 10-Ks) filed via the Edgar SEC filing system. The public data is then supplemented with survey data collected for executive pay levels of incumbents whose compensation is NOT required to be disclosed.
Let’s analyze a benchmark report for Canadian data of the top five C-Suite executive positions typically disclosed in annual filings: CEO, CFO, COO, CMO, and CHRO.
Source: ERI’s Executive Compensation Assessor
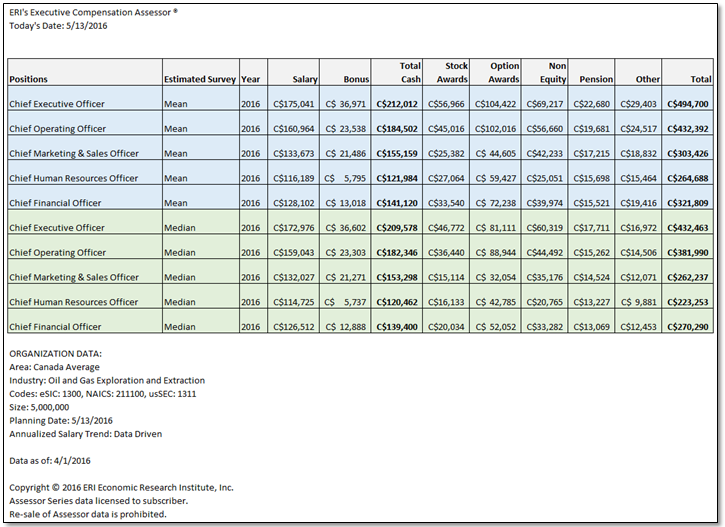
In this example, the job scope criteria selected includes a revenue size of CAD 5 million revenue in the Oil and Gas Exploration and Extraction industry sector, building on the earlier example. The benchmark report includes all the essential executive compensation components, such as base salary, cash bonus and incentives, and equity awards like restricted stock units and stock options as well as retirement pensions and other perquisites for executives. Comparing the median and mean values can also be meaningful. In this example, the CEO total compensation ranges from CAD 432,462 to CAD 494,700, representing a 14%+ difference in pay level.
HR leaders are in an enviable position to be “in the front seat” when organizations are expanding operations into new geographies. The effectiveness of the journey requires insightful solutions that combine internal and external realities coupled with reliable data and tools. ERI compensation analytic solutions are an invaluable tools for HR and total rewards leaders in this regard. For more information about North America compensation benchmarking, call us today at 800-627-3697, and one of our best in class service team members will assist you.