How an organization pays its executive management needs to be strategically aligned with short-term objectives and, most importantly, the long-term goals of the business. The complexity of executive total rewards is due to the following:
- Stakeholders: There are many constituencies that have an interest or active role in determining executive pay, namely the Board of Directors, shareholders, and the incumbent executive employee.
- Components: In addition to base salary, this includes performance-based and discretionary cash compensation, equity awards delivered with stock options, restricted units, restricted stock awards, and/or performance equity awards.
- Competition: The executive talent pool of effective leaders, as well as experts in their business sectors, is limited; top executives are coveted by other companies.
If you are trying to benchmark executive roles typically not included in the annual filings, ERI’s Executive Compensation Assessor can help. At ERI, we have subscribers from small businesses with $1 million or less in revenue to Fortune 10 global companies with over $20 billion in revenue. At first glance, a total rewards practitioner will ask this question:
The answer is compensation analytics. By applying times series regression analysis, a reasonable compensation benchmark estimate is available based on criteria specific to the position: job content, revenue size, industry, and geography.
Data for top executives at publicly-traded organizations is available in the annual filings, as required disclosures for their shareholders. The data is in a table called the Summary Compensation Table (SCT), which has up to seven compensation components: salary, bonus, stock awards, option awards, non-equity incentive compensation, change in pension and non-qualified deferred compensation, and all other compensation. Some public data pay elements use different terms. The table below includes their definition and intended purpose, which can be readily translated for compensation programs of privately held small and medium-size businesses (SMBs). Once the similarities of the terms are evaluated, the associated compensation analytics benchmarks can be appropriately applied.
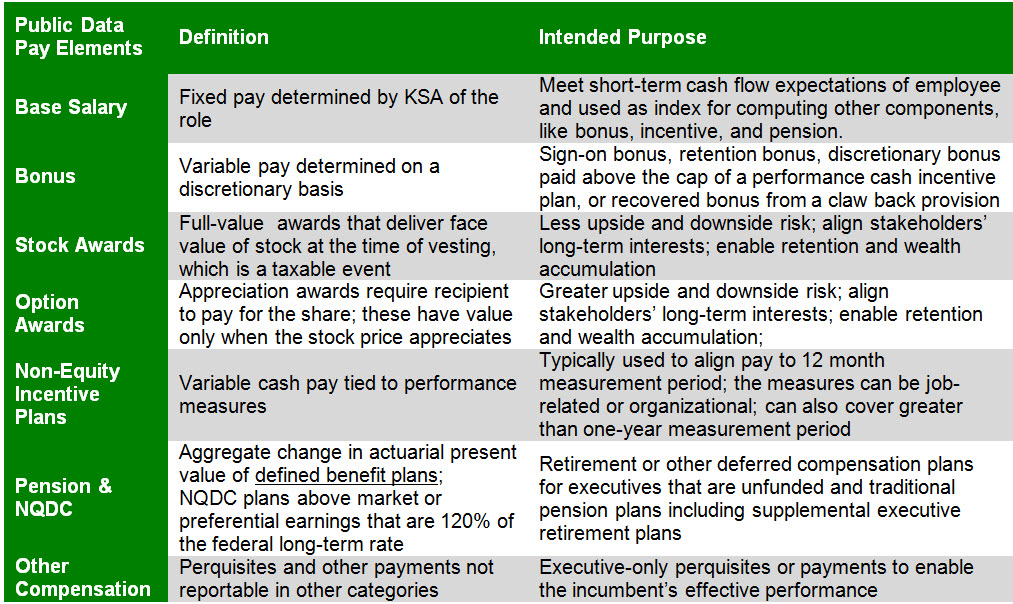
The definitions and intended purpose are similar in SMBs that are privately held. The equity compensation components in privately held companies, however, are typically phantom stock plans that can be designed as full-value awards or appreciation awards, depending on the business objectives and organization culture.
Let’s take a look at a compensation analytics benchmark for CEO.
Image: ERI Executive Compensation Assessor (XA) – Survey & Proxy Analysis Tab
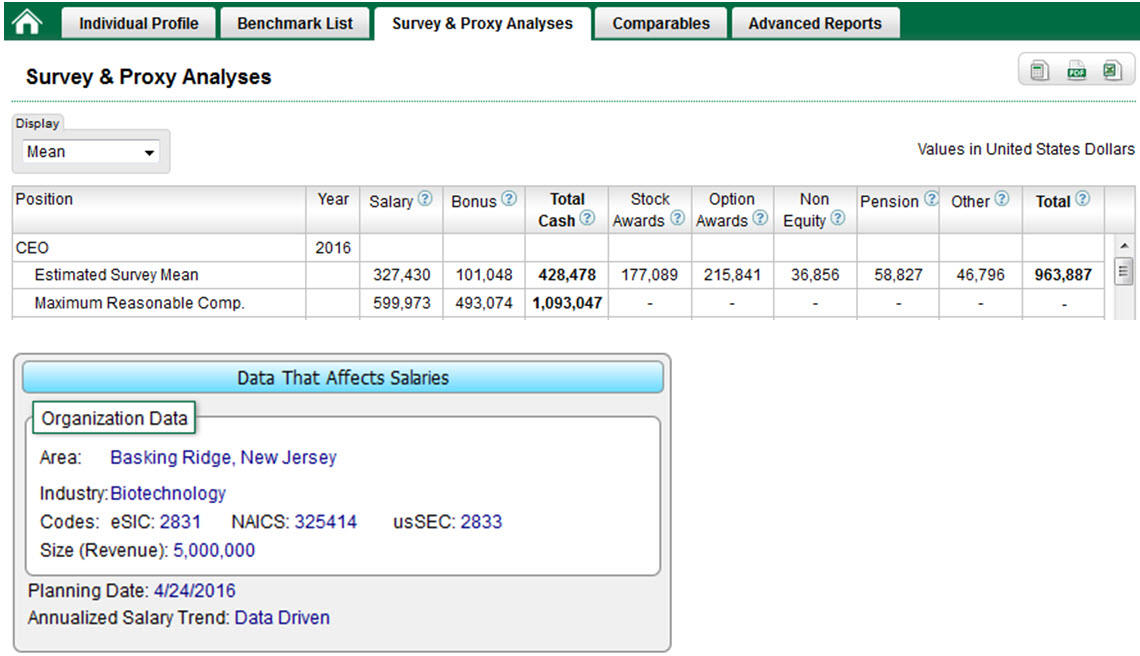
The estimated survey mean for the total compensation of the CEO in a biotechnology company with $5 million revenue in Basking Ridge, NJ, is $963,887. The base salary benchmark is $327,430. Also shown is the maximum reasonable compensation benchmark of $1,093,047, which represents estimated maximum reasonable compensation limits for salary plus bonus.
Executive total rewards programs have various components which need to be evaluated: base salary, cash incentives, equity, perquisites, and retirement plans. Having reliable and robust compensation analytics to benchmark these critical executive roles can be a strategic competitive advantage. To learn more about executive compensation data and related compensation analytic solutions, call us today at (800) 627 3697, and one of our best-in-class service team members will assist you.